Using convolutional neural networks to automate tropical pollen counts and identification
Contributed by: Derek Haselhorst, Program in Ecology, Evolution and Conservation Biology, University of Illinois
Pollen and spore (palynomorph) records provide one of the most comprehensive archives of terrestrial vegetation history, dating as far back as the first land plants approximately 470 million years ago1. Embedded within sedimentary deposits, the pollen grains preserved at different time intervals provide detailed records that can be used to reconstruct how terrestrial vegetation communities responded under previous periods of climatic and environmental change2,3. While many species recorded in the fossil pollen record are no longer present today, our understanding of the past can be improved by looking at samples of aerial pollen (pollen rain) collected from a range of modern forest environments today using pollen traps.
As part of my graduate research in Dr. Surangi Punyasena’s pollen and paleoecology lab at the University of Illinois, I have counted and analyzed two, extended modern pollen rain records from Barro Colorado Island (BCI), Panama; a 10-year record collected from the Lutz weather tower and a 15-year record collected from the Center for Tropical Forest Science (CTFS) study plot on the island4,5. Hyperdiverse lowland tropical forests such as BCI produce pollen assemblages that are characterized by an extensive number of different pollen morphotypes4. Each pollen type corresponds to a different parent plant species and is defined by a suite of morphological characters unique to that pollen grain (Figure 1). For pollen types characterized by more conspicuous differences in shape, size, and surface ornamentation, a pollen grain can be identified to the genus- or species-level with a relatively high degree of confidence. However, many closely- and even some distantly-related plant taxa can produce pollen grains that look virtually identical to one another.
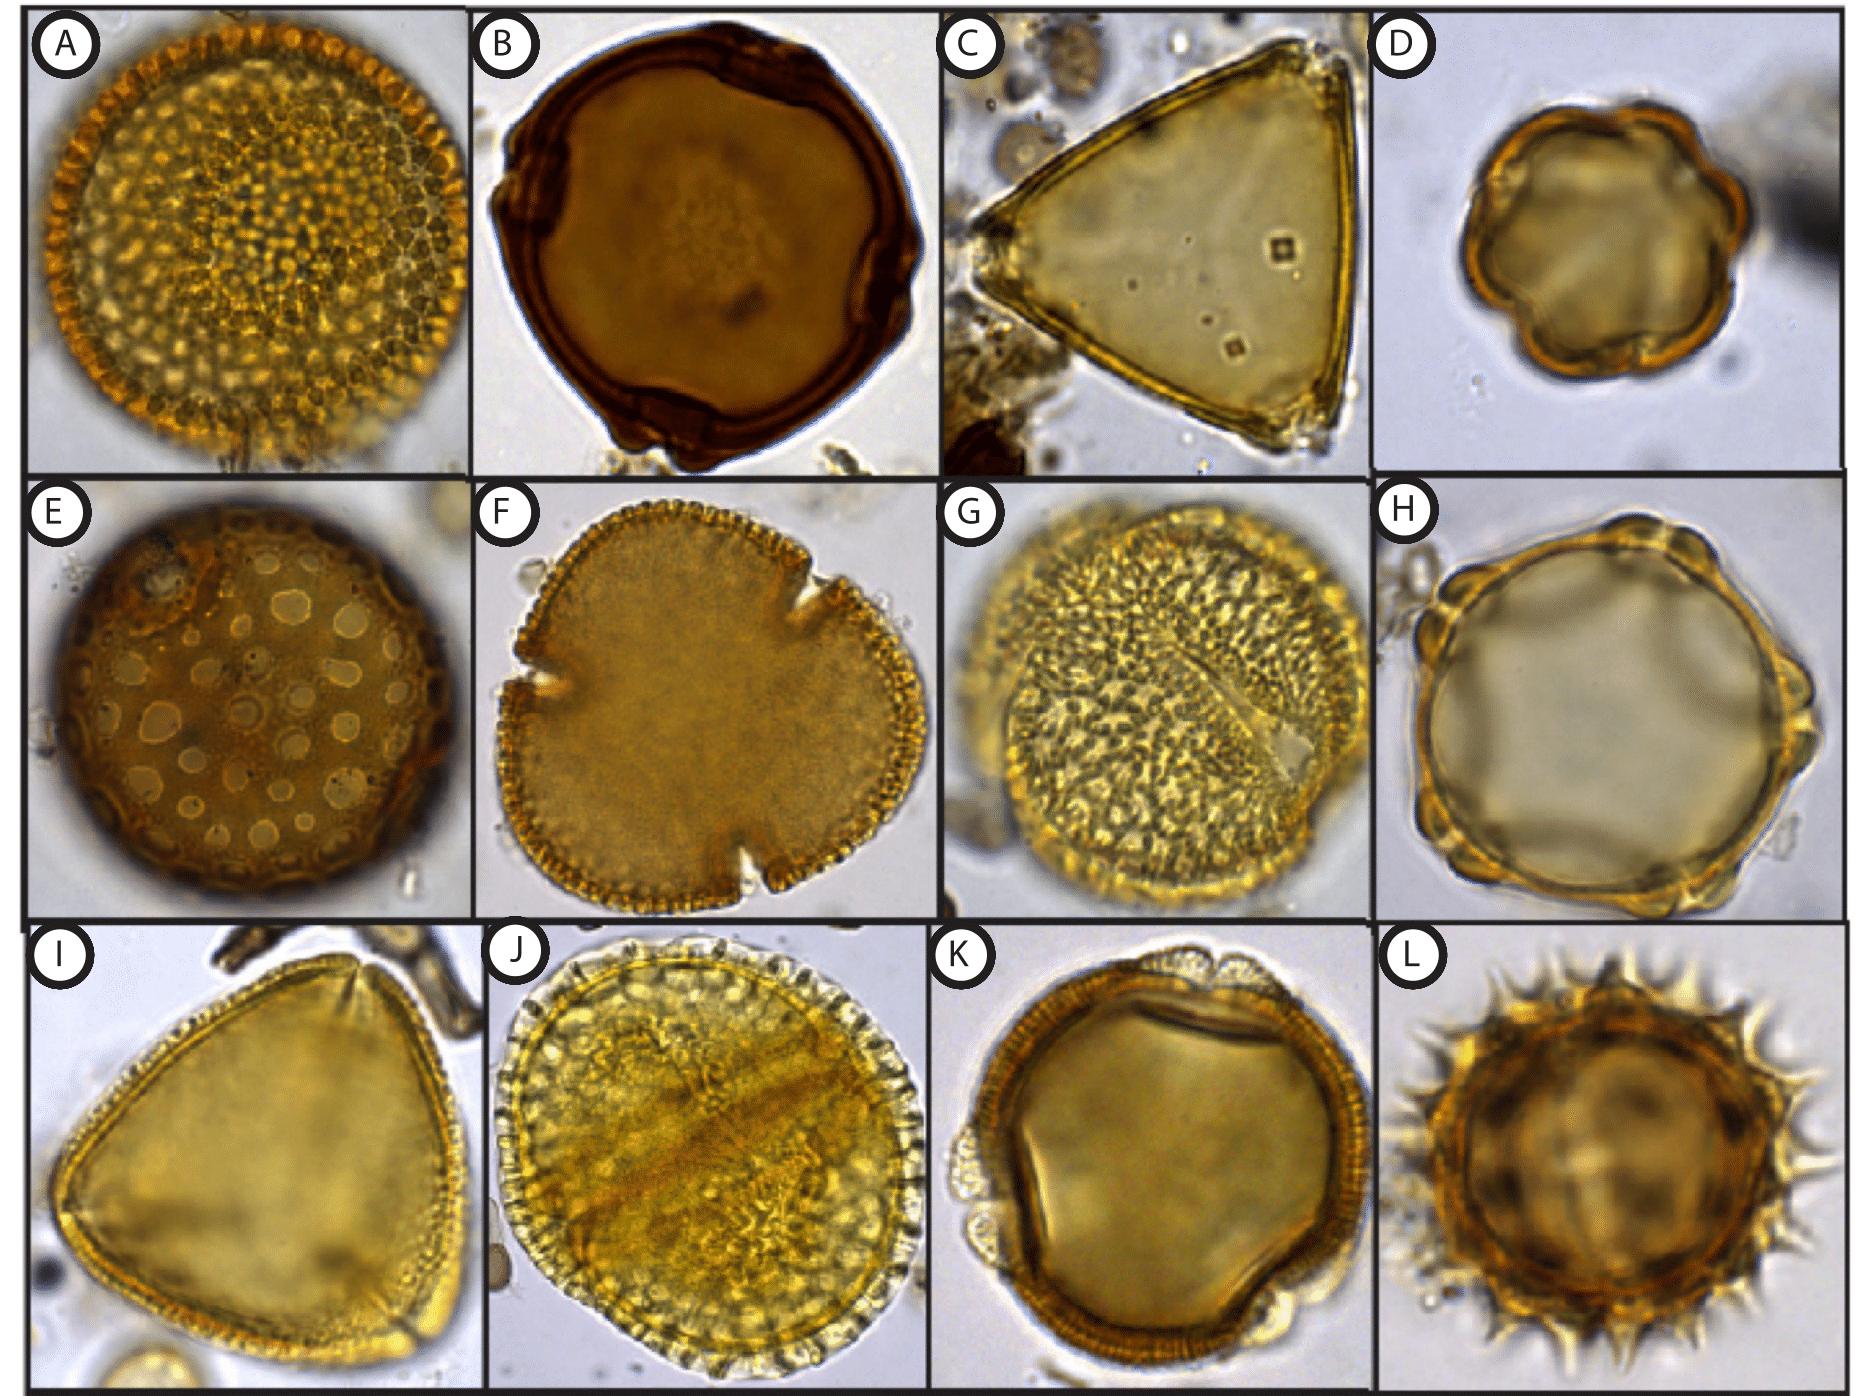 |
Figure 1- A sample of different pollen grain morphology: A) Croton (Euphorbiaceae) B) Trichilia (Meliaceae) C) Serjania (Sapindaceae) D) Combretum (Combretaceae) E) Quararibea (Malvaceae) F) Pseudobombax (Malvaceae) G) Posoqueria (Rubiaceae) H) Alnus (Betulaceae) I) Quassia (Simaroubaceae) J) Dalechampia (Euphorbiaceae) K) Anacardium (Anacardiaceae) L) Asteraceae |
To the pollen analyst (palynologist), identification of visually similar pollen types is both difficult and time consuming, and the challenges of parsing small morphological differences can sometimes lead to misclassifications. In some instances, pollen analysts may need to create a coarse taxonomic grouping comprised of several visually similar pollen types. Unfortunately, these taxonomically unassigned types do not yield the same level of environmental information as grains identified to the genus- or species-level, which can limit the resolution of biome reconstructions based on pollen data. Due to limitations of the human eye to detect fine-scale differences in pollen morphology and the time constraints inherent to manual counting, we partnered with Dr. Charless Fowlke’s computer vision group at the University of California Irvine to automate the process of pollen counts and identifications using a convolutional neural net (CNN) machine learning approach.
The initial step in the pollen automation workflow related to scanning the images. Microscope slides from both BCI pollen rain records were imaged using a slide scanning microscope (Hamamatsu Nanozoomer) originally developed to image pathology tissue samples. We utilized the abilities of this microscope to scan each slide at 41 axial z-planes of focus (from -20 um to 20 um) at 400x magnification. This allowed us to obtain the amount of morphological detail on the pollen grains needed to make an identification while maintaining a reasonable file size. One sample was ~400 GB and we were able to scan around 12 slides in a 24-hour period. Raw image data were saved to an 8 TB external hard drive connected to the slide scanning computer.
Using the raw image data, we randomly subsampled 1000x1000 pixel PNG images from each scanned slide using a Java script. The 41 axial planes were stitched together providing a set of 500-1000 composite images for each scanned microscope slide. The images corresponding to each slide were read and displayed on a desktop computer in the lab using a virtual microscope script developed in Matlab. The virtual microscope functions much like a brightfield microscope, allowing for the user to scroll up or down through the focal planes of a composite image in order to visualize the entire grain using the scroll of a mouse. The images were randomly displayed and I was able count and identify each pollen grain using simple mouse and keyboard functions (Figure 2). For each image file, I provided a 3-letter identification code and the approximate radius for each grain present. Additional metadata were also recorded for each image, including a slide identifier and xy-coordinate for each identified grain.
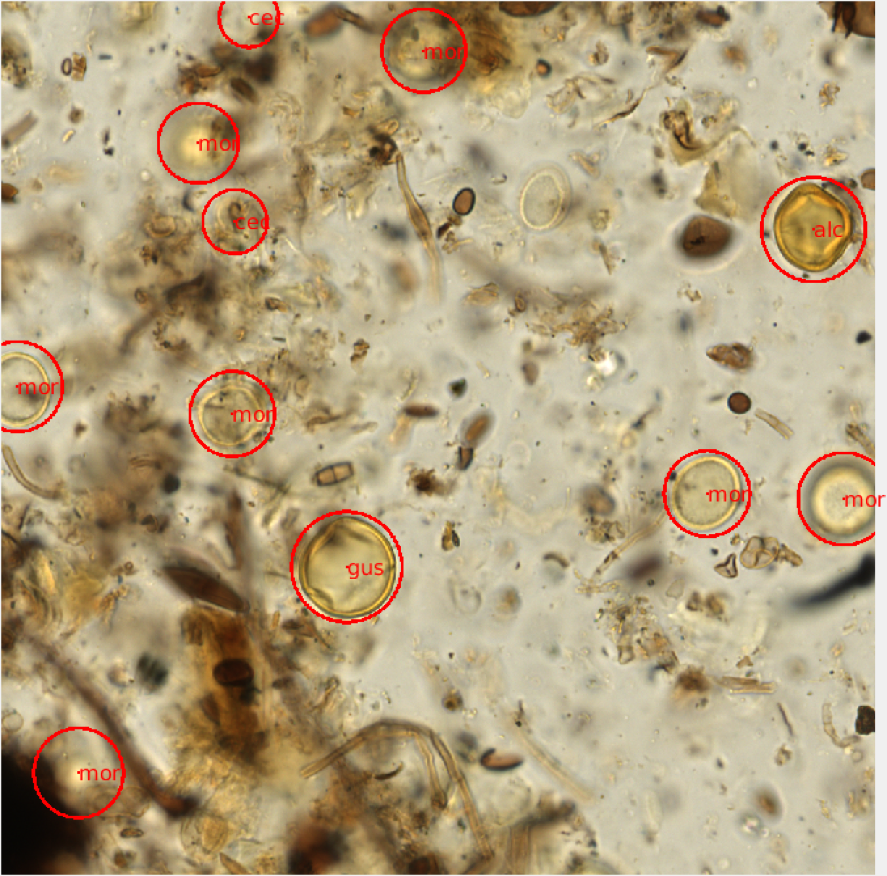 |
Figure 2- A visual representation of an annotated virtual microscopy pollen slide image. Each grain was circled and identified using a 3-letter taxonomic naming system. The identification and locality of each grain was saved as metadata for each image window. |
After the pollen counts were completed, the raw PNG images and metadata were then transferred to the UC Irvine group using our lab server. There, fellow graduate student Shu Kong trained convolutional neural nets on the annotated image data provided, and used a second set of unannotated images as the testing set. The CNN and a non-maximum suppression approach were used to scan each image for morphological patterns corresponding to each pollen id. Once trained, the neural nets were then able to recognize areas of likely pollen within each raw, unannotated image and propose a pollen identification (Figure 3).
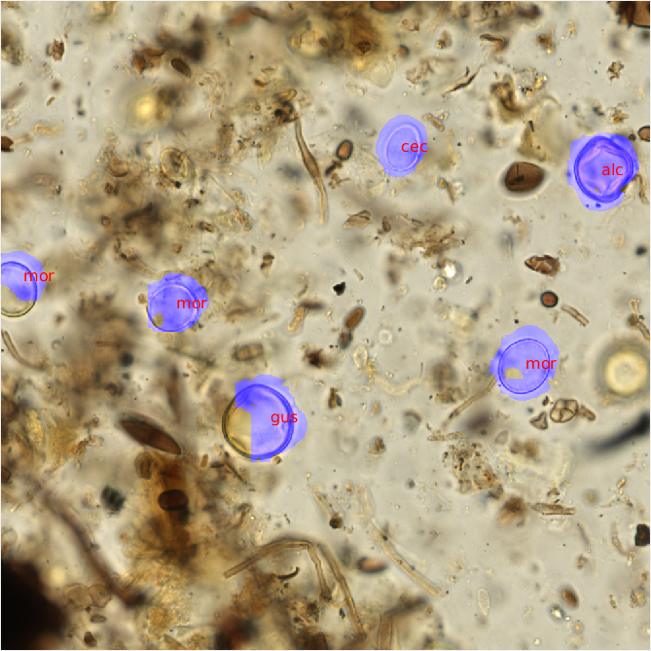 |
Figure 3- Predicted pollen identifications were made using trained convolutional neural nets. The trained pollen identification system was able to replicate my identifications on visually similar pollen types (gus and alc). |
To date, classification matrices have been constructed for the 47 most abundant pollen types, but additional morphotypes will be included as more annotated image data are used to train the neural nets. In our initial run, we were able to achieve 70% accuracy when all 47 pollen types were included. However, the system performed best when identifying the most abundant pollen types and improved as more examples were provided. When isolating the 25 most accurate types, the convolutional neural nets were able to replicate my annotated counts at an accuracy 87.25%, including seven pollen types at over 90% accuracy (Figure 4).
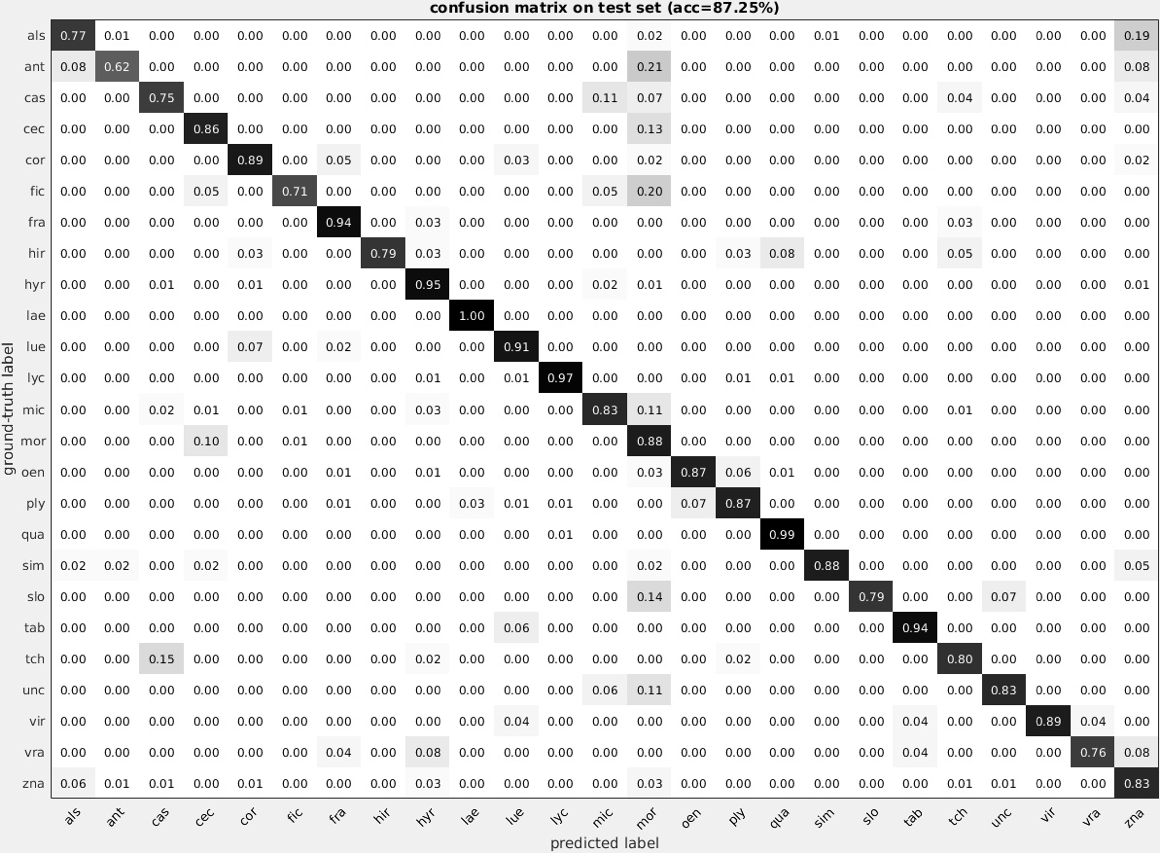 |
Figure 4- A confusion matrix was generated for the 25 most accurate pollen grains. The pollen identification was able to replicate my own counts at an accuracy of 87.25%.
|
In total, I recorded over 130 unique pollen types in the BCI pollen rain. These types were identified with the help of a pollen reference collection and published pollen photographs corresponding to plant species on the island6. However, even with an extensive reference collection and a guide, over 15 of these pollen types were identified at either the family-level or as an unknown morphotype. We believe that accuracy can be further improved by using training data obtained directly from reference material collections and herbaria specimens. Our initial results are based on a single expert (myself), and utilization of these additional sources of palynological information would reduce human-induced error that might otherwise limit the effectiveness of the CNN. Moving forward, we propose that a collaborative community of palynologists can utilize and harness a shared image database of pollen types to corroborate pollen identifications, expedite counts, and enrich our understanding of how terrestrial communities have changed through space and time.
Works Cited
- Rubinstein, C. V., Gerrienne, P., de la Puente, G. S., Astini, R. A. & Steemans, P. Early Middle Ordovician evidence for land plants in Argentina (eastern Gondwana). New Phytol. 188, 365–369 (2010).
- Mejia-Velasquez, P. J., Dilcher, D. L., Jaramillo, C. a, Fortini, L. B. & Manchester, S. R. Palynological composition of a Lower Cretaceous South American tropical sequence: climatic implications and diversity comparisons with other latitudes. Am. J. Bot. 99, 1819–27 (2012).
- Jaramillo, C. Response of tropical vegetation to Paleogene warming. Paleobiology 28, 222–243 (2002).
- Haselhorst, D. S., Moreno, J. E. & Punyasena, S. W. Variability within the 10-Year Pollen Rain of a Seasonal Neotropical Forest and Its Implications for Paleoenvironmental and Phenological Research. PLoS One 8, (2013).
- Haselhorst, D. S., Tcheng, D. K., Moreno, J. E. & Punyasena, S. W. The effects of seasonal and long-term climatic variability on Neotropical flowering phenology: An ecoinformatic analysis of aerial pollen data. Ecol. Inform. 41, 54–63 (2017).
- Roubik, D. W. & Moreno, J. E. Pollen and spores of Barro Colorado Island. Missouri Botanical Gardens (1991).