Spatial Phylogenetics of Florida Vascular Plants: The Effects of Calibration and Uncertainty on Diversity Estimates
By: Charlotte Germain-Aubrey and Julie Allen
With online repositories such as iDigBio growing rapidly in the number of specimen records available, we now have the ability to examine broad distributional patterns of plants and animals. While traditional biodiversity measures have focused on counts of species in a region of interest, particularly exciting is also integrating more about the evolutionary history of those species. Such a combined approach can help reveal not only how numbers of species vary across space, but also how those patterns may have originated as species assembled into communities.
However, the evolutionary trees used in these kinds of studies are often not built by the authors performing the study. Instead, ecologists have relied on existing tree resources. While these repositories are incredibly important for research, the trees they provide may not be appropriate for a given geographic region or set of species. Generally, tree building is not necessarily afforded the same level of scrutiny as analysis of spatial data, despite the critical importance of trees for producing evolutionary perspectives on communities. In this paper, we built the largest dataset of species distribution models of vascular plants in Florida, with ~1,500 species, along with an evolutionary tree of these same plant species to examine spatial phylogenetic patterns across the state. We compared our results with those obtained using existing tree repositories.
Phylogenetic approaches extend diversity measurements from simplistic species counts to measures that also inform evolutionary pattern and process. When examining the results with our carefully built evolutionary tree, we found that spatial phylogenetic patterns across Florida were consistent with previous estimates of species diversity patterns based on species counts. For example, the highest phylogenetic diversity (PD) occurred from the northern parts of peninsular Florida southward to near Orlando and St. Petersburg (Figure1). PD was higher in central Florida than in the northern and southern parts of the state. South Florida showed a mix of patterns longitudinally; the Everglades and Big Cypress had relatively low PD, whereas Miami Ridge, at the same latitude, had relatively high PD. These areas of high and low PD correspond to regions of high or low species diversity, but the PD results, because they incorporate evolutionary history, are a more rigorous assessment of state-wide plant diversity than measures of the number of species.
We used two types of evolutionary trees in this study: phylograms, trees in which the branches tell us how many molecular changes have occurred, and chronograms, which tell us about the time elapsed along the branches. PD can be interpreted either as the amount of ‘‘feature diversity’’ contained within a region of interest when using a phylogram, i.e., the number of evolutionary changes present in an area, or as the amount of ‘‘evolutionary history’’ when using a time-calibrated chronogram. The tree topology - that is, the branching order - is the same in the two tree types, whereas the branch lengths differ, and each approach has unique interpretations. An analogy would be a consideration of travel directions for a route using either geographic distance or time; both indicators are informative in different ways. Each of these trees gives different and important patterns that inform our understanding of Florida’s plant diversity. For example, in Figure 1, we can see that when we look for areas with significantly high or low PD, we get different patterns for each tree. Using the phylogram, we mostly find areas with significantly fewer changes than expected by random chance. However, on the chronogram, we find that in the panhandle of Florida, the communities have taken significantly longer to assemble than the other communities in Florida.
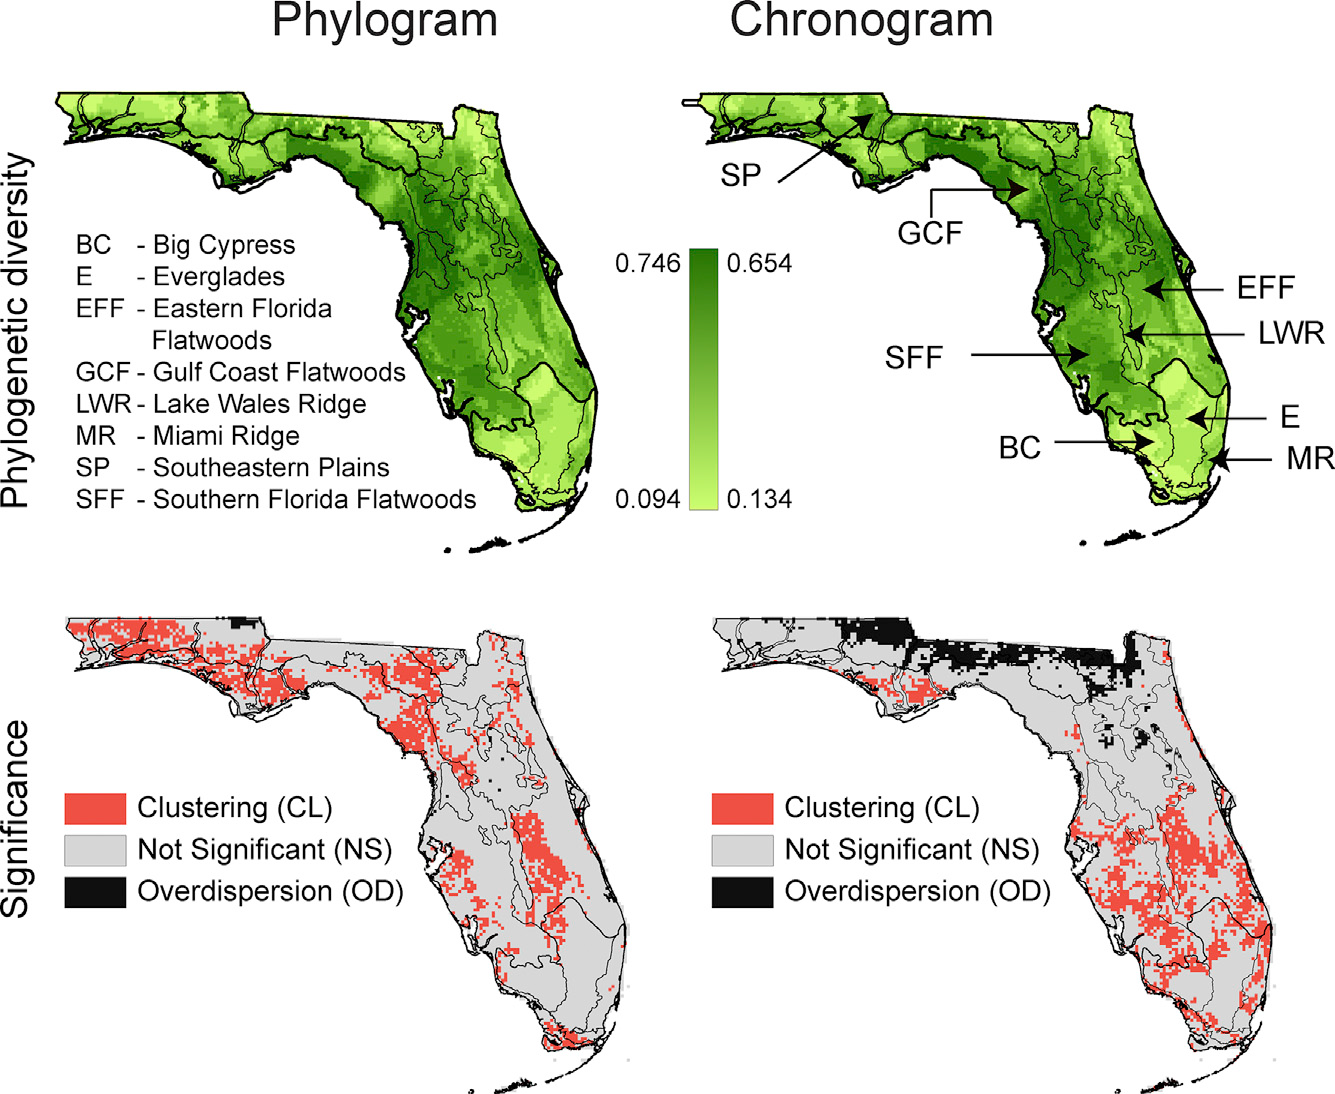
Figure 1. Phylogenetic Diversity of Vascular Plants in Florida
Observed phylogenetic diversity measured from phylogram (left) and chronogram (right) for vascular plants. The Environmental Protection Agency Level III ecoregions are mapped with the darker lines, and Level IV ecoregions are mapped with the lighter lines.The lower panel indicates areas with significant levels of PD either significantly low (red - clustering) or high (black - overdispersed).
Similar patterns of PD emerged when comparing the results using alternative source trees. For example, the Open Tree of Life (OTL) is a new tree repository that is continuously updated as new data come online. Each source phylogram produced PD values with significant clustering in the Florida panhandle and along peninsular Florida (Figure 2). Our results suggest that, in the future, the OTL may be an important resource for spatial phylogenetic analyses. Providing there is adequate sampling of the terminal taxa in a region represented in the OTL, researchers will be able to save numerous hours in building their own region-specific trees.

Figure 2. Diversity Hypothesis Tests Comparing Chronograms and Phylograms for Vascular Plants Built Using the Open Tree of Life
In the top panel are phylograms and chronograms for the purpose-built tree pruned to the Open Tree taxon dataset. In the middle panel are the Open Tree of Life trees. In the lower panel are the differences between the two maps.
Conculsions
Two particular areas of interest, given known endemicity and unusual floras, are the Miami Ridge/ Pine Rocklands and the Lake Wales Ridge (LWR). The Pine Rocklands exhibit a diverse flora of hammock species and those species common across the Bahamas and Greater Antilles. In the Miami Ridge area, as expected, we found increased PD for some pixels based on the chronogram. The LWR, in particular, is known to harbor high endemic species diversity, which we hypothesize may show high neo-endemism (more recently established endemics relative to other Florida species included in the tree) when examined using phylogenetic endemism metrics in the future. We found that LWR is neither particularly high in PD and nor does it show significantly clustered areas (aggregation of areas with PD significantly higher than others in the area of study); however, areas immediately east of LWR show strong clustering. This region is a mosaic of habitats, including pine flatwoods, dry prairies, and marshes, and the significant clustering in this area may indicate strong filtering for these habitats. It also suggests that conservation priorities should not only be concentrated in areas such as the LWR but also include those areas directly adjacent to it along zones of highly varying diversity. Zones of conservation priority are also found in areas such as the Miami Ridge/Pine Rocklands, which are under direct threat from rapid, continuing human development and provide a further strong justification for conservation actions to support these unique evolutionary assemblages.
To obtain a more informed picture of conservation priorities, future studies are needed of phylogenetic endemism and associated hypothesis tests to complement the PD studies reported here. Future analyses of PD can compare the ecoregions noted above, as well as native habitats and protected areas, or introduced/alien species, thereby informing conservation priorities for human managed habitats and regions as well as those areas experiencing rapid land conversion in Florida.